The best two sources of information known to the writer by which this estimate may be checked are the receipts of the New York market and the annual “Value of Poultry and Eggs Sold,” as given by the Kansas State Board of Agriculture.
[Illustration: Plate I. Page 14. Graph — Is There Money in Poultry?]
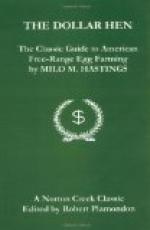
In plate I the top curve a-a gives the average spring price of Western first eggs in the New York market. The curve b-b gives the annual receipts of eggs at New York in millions of cases. Now, since value equals quantity multiplied by price, and since the quantity and values of poultry are closely correlated to those of eggs, the product of these two figures is a fair means of showing the rate of increase in the value of the poultry crop. Starting with the census value of $291,000,000 for the year 1899, we thus find that by 1907 the amount is very close to $700,000,000. This is represented by the lower line.
The value of the poultry and eggs sold in Kansas have increased as follows:
Year Value
1903 $ 6,498,856 1904 7,551,871 1905 8,541,153 1906 9,085,896 1907 10,300,082
The dotted line e-e represents the increase in the national poultry and egg crop estimated from the Kansas figures. Evidently the estimate given in Secretary Wilson’s report was not excessive.
Now, I want to call the reader’s attention to some relations about which there can be no doubt and which are even more significant. The straight line c-c in Plate 1 represents the rate of increase of population in this country. The line b-b represents the rate of increase in egg receipts at New York. As the country data backs up the New York figures, the conclusion is inevitable that the production of poultry and eggs is increasing much more rapidly than is our population.
“Over-production,” I hear the pessimist cry, but unfortunately for Friend Pessimist, we have a gauge on the over-production idea that lays all fears to rest. When the supply of any commodity increases faster than the demand, we have over-production and falling prices. Vice-versa, under-production is shown by a rising price. That prices of poultry and eggs have risen and risen rapidly, has already been shown.
“But prices of all products have risen,” says one. Very true, but by statistics with which I will not burden the reader, I find that prices of poultry products have risen more rapidly than the average rise in values of all commodities. This shows that poultry products are really more in demand and more valuable, not apparently so. Moreover, the rise in the price of poultry products has been much more pronounced than the average rise in the price of all food products, which proves the growing demand for poultry and eggs to be a real growing demand, not a turning to poultry products because of the high price of other foods, as is sometimes stated.